Message from the TeamWelcome to Centre Urban’s Third Quarter 2023 Market Insights Report, where we evaluate the current status of the commercial real estate market and review the key indicators we monitor. Commercial real estate investment continues to face headwinds primarily driven by the US Federal Reserve’s interest rate hiking campaign to combat persistent inflation. This has put pressure on the cost of borrowing and asset valuations, with interest rates on stabilized commercial real estate approaching 8.0% and cap rates expanding over 60 basis points from recent lows. There are a growing number of indicators and forecasts that predict a moderate recession in the next 12 months. However, as Ray Dalio says, “most of life’s greatest opportunities come out of moments of struggle”. Whether or not there is an impending recession or if it is a hard or soft landing, what is clear is this is a time of transition such as we have not seen for over a decade. As in the 2008 Global Financial Crisis, the last period of transition, those who are well-informed and disciplined will see successes. Centre Urban continues to stay informed on the economic data so that we are best able to identify opportunities and mitigate against potential risks. Within Centre Urban’s targeted geographies of Southern California and Honolulu, Hawai’i we are observing trends that support our investment thesis that supply-constrained, high-demand markets with high political and geographical barriers to entry, strong household incomes, and robust job infrastructure will better weather turbulent times compared to other major US markets that have experienced increasing new supply and volatile rents. Throughout our investment portfolio, Centre Urban prioritizes historic trends of strong net asset value appreciation, low vacancies and modest rent growth. We continue to monitor the market data to stay informed on major decisions for current assets under management and new investment opportunities. Key Indicators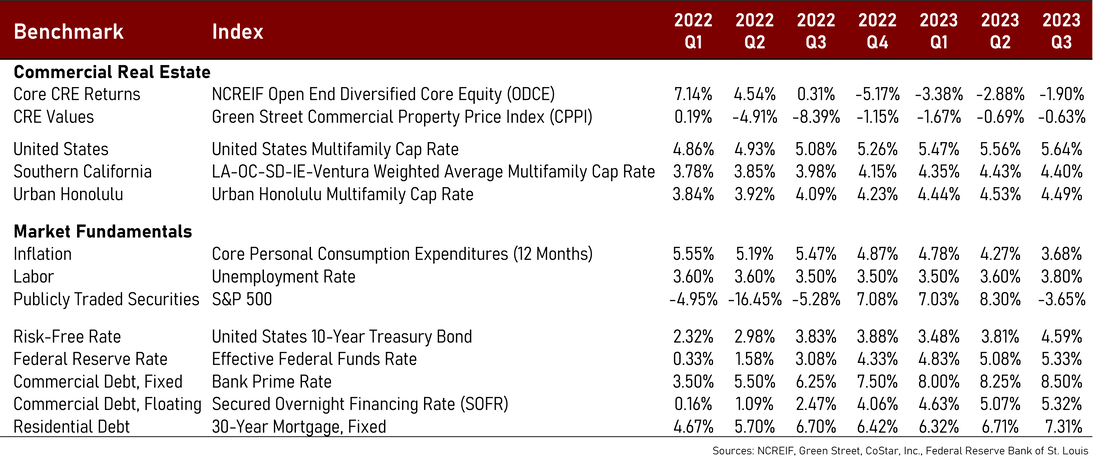 The Fed’s historic rate hike campaign is well underway to combat rampant inflation driven by the aftereffects of the COVID-19 pandemic. Our key indicators are Core Personal Consumption Expenditures, the Fed’s preferred measure for inflation, and the 10-year US treasury bond yield, which influence CRE interest rates and cap rates. The Fed has increased its benchmark borrowing rate 12 times, totaling 525 basis points from near zero in March 2022. The current range of 5.25%-5.50% is the highest in 22 years. The economic data we are currently observing is eerily similar to the period leading up to the 2008 Global Financial Crisis, which saw a Fed rate hiking campaign from 2004 to 2006 with a cumulative increase of 425 basis points. Inflation continues to trend downward in Q3, coming in at 3.68% - which is good progress from the peak of 5.55% in Q1 2022 - but was higher than projected and still well above the Fed’s 2% target. This increases the potential for an additional rate hike in December 2023 and a Fed policy of “higher for longer”. Alongside the increases to the Fed funds rate, the 10-year US treasury bond, seen as the “risk-free rate”, has seen an increase to 4.59% (and further increased in October). This has put upward pressure on multifamily cap rates and interest rates, as most investments reference the risk-free rate as a benchmark. We are eagerly anticipating the “high water mark”. These data points are highlighted in the table above. Economy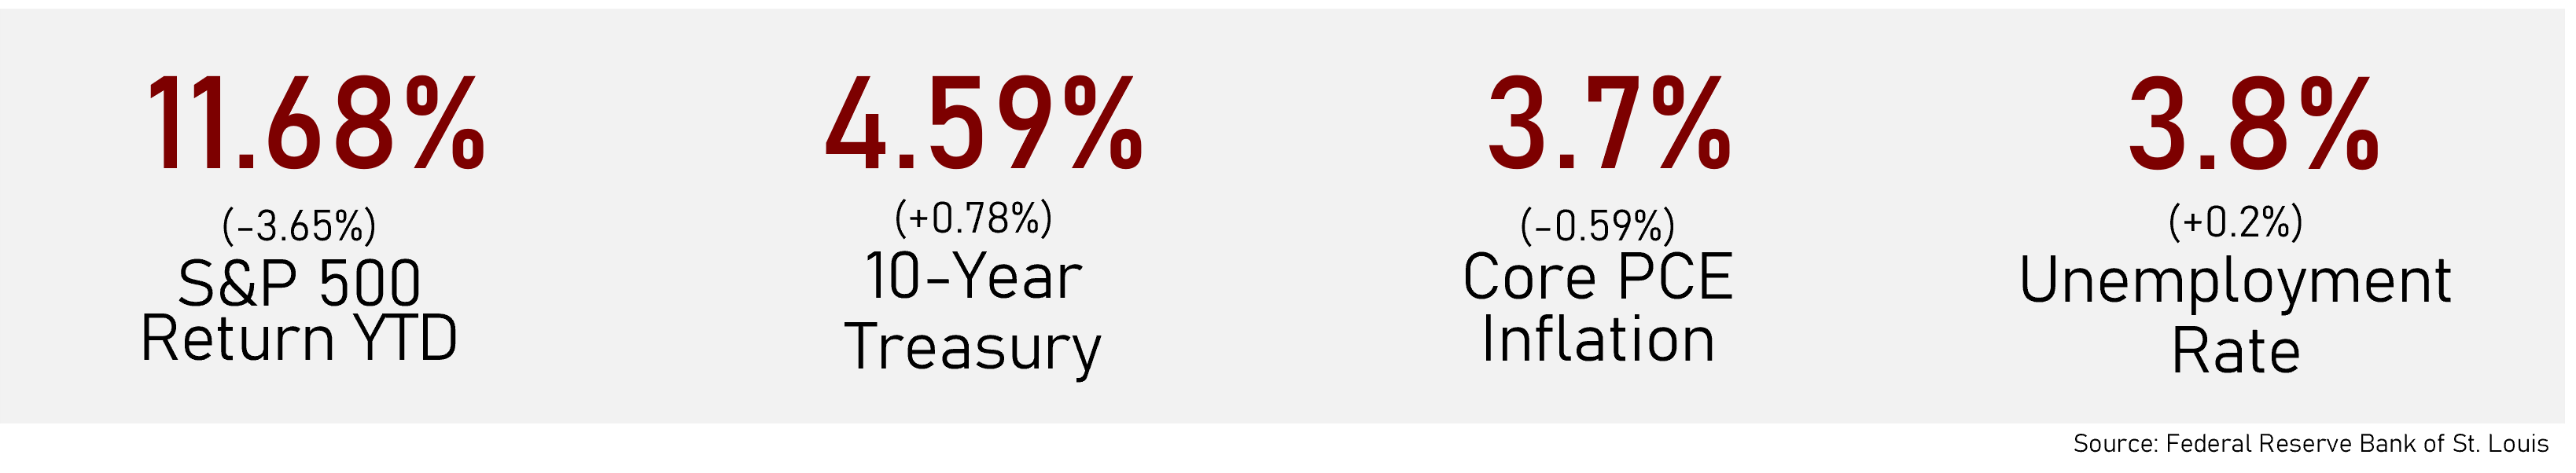 Most investment segments - including stocks, bonds, and commercial real estate - are experiencing volatility as investors undergo price discovery. In an era of “bad news is good news” it is expected that the market will need to see further declines before economic growth returns. While the S&P 500 is up almost 12% for the year, it is worth noting that it declined by 3.65% in Q3, which ate into the strong growth seen in the first half of 2023. This follows the trend of most publicly traded stocks, which continues to be volatile after seeing a return of -18.1% in 2022. The average annualized return since the S&P’s inception in 1928 through 2022 is 9.82%. The bond market has not faired much better in terms of volatility, with the 10-year treasury bond yield increasing by 71 basis points since the beginning of the year, after increasing by 156 basis points in 2022. Since bond yields move inversely with price, this has resulted in a significant decline in bond values, which in part contributed to the failures of Silicon Valley Bank, Signature Bank, and other regional banks. Core Personal Consumption Expenditures (PCE), which is the Federal Reserve’s preferred measure of inflation, continues to trend downward to 3.7% in Q3, down from 4.3% in Q2 and well below the peak of 5.5% in Q1 2022. Core PCE excludes volatile food and energy prices. At the same time, the unemployment rate increased slightly to 3.8% in Q3 from 3.6% in Q2, driven in part by labor disputes throughout the country including Southern California. While the increase in unemployment is not significant, it is worth monitoring this new upward trend, given unemployment has remained between 3.5% and 3.6% for the past two years. The Fed has a dual mandate of stable prices, defined as a 2% inflation rate, and maximum sustainable employment. With inflation remaining well above the Fed’s 2% target, the current elevated interest rate environment will likely remain the status quo for the foreseeable future, likely through most of 2024 barring a major shock to the economy that causes unemployment to increase dramatically. These market indicators have pushed mortgage rates to historic highs for both commercial and residential properties. The 30-year residential mortgage rate increased to 7.31%, in Q3 up dramatically from the low of 2.67% at the end of 2020. The WSJ prime rate, typically used as a benchmark for commercial mortgages, has increased to 8.5% in Q3, up from a low of 3.25% in 2020. The high interest rate environment has put pressure on real estate values and cashflow. Further, while national new multifamily supply continues to grow, primarily in the Midwest and Southeast, the majority of these were approved prior to the current market environment. We anticipate a significant decline in new supply over the next few years as the development pipeline slows. Southern California Real EstateCentre Urban defines Southern California as Los Angeles County, Orange County, San Diego County, Ventura County, and the Inland Empire, comprising San Bernardino and Riverside Counties. Market fundamentals in Southern California are turbulent due to macroeconomic headwinds and local labor disputes, though various submarkets have demonstrated resilience. 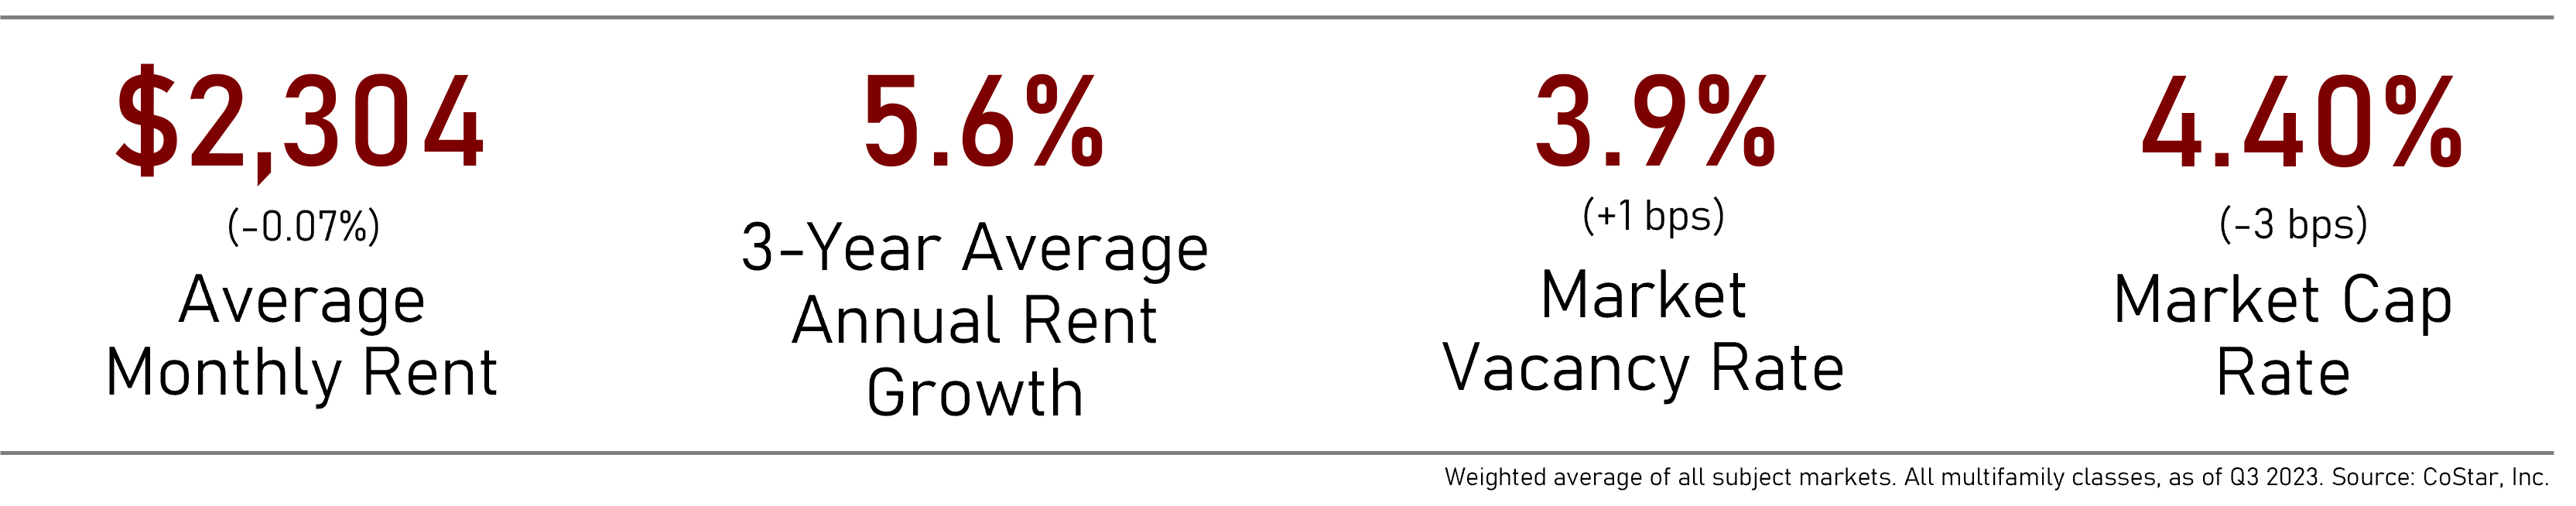 Multifamily Insights Rents throughout Southern California remain among the highest in the nation, with a weighted average rent of $2,304, well above the national average of $1,653. However, rent growth after a series of high growth quarters has started to slow, with a weighted average growth rate of 0.77% over the past 12 months. This is significantly down from the 3-year average rent growth of 5.6%. Renters remain cautious in the face of economic uncertainty and inflation. As a result, vacancy increased from 3.3% one year ago to 3.9% today, though remains relatively tight compared to the national vacancy rate of 5.6%. The weighted average market cap rate for Southern California saw a slight compression to 4.40% in Q3, a 62-basis point expansion from the recent low of 3.77% in Q4 2021, and moderately above its trailing three-year average of 4.07%. This trend outperforms that of the greater US, which saw a 78-basis point increase in cap rates to 5.64% from the recent low of 4.86% in Q1 2022. Multifamily sales activity has dramatically slowed, primarily driven by a combination of high interest rates and costly local regulations, such as the City of Los Angeles’s ULA transfer tax of 4.0% for any sale above $5 million and 5.5% for any sale above $10 million. The new transfer taxes are on top of the 0.45% transfer tax the city had in place before April 2023. As such, Q3 2023 multifamily sales activity in LA County has declined to $856 million, which is just a third of the average quarterly sales over the past decade of $2.2 billion. Demand for rental housing in Southern California is further driven by the high cost of homeownership, where the median sale price for a single-family home is now $820,000, with average home prices being as high as $1.3 million in Orange County, as reported by the California Association of Realtors. Southern California has a weighted 2023 area median income of approximately $113,400, ranging from a low of $94,500 in the Inland Empire to a high of $127,800 in Orange County. Notwithstanding the relatively high incomes, due to increased high home prices and interest rates, homeownership is simply not feasible for many households. Economy With a total population of over 23.7 million, the leading industries driving the Southern California economy are entertainment, tourism, international trade, fashion, tech, and aerospace. Ongoing labor disputes have resulted in economic disruptions throughout Southern California, though the Southern California Association of Governments (SCAG) reports a moderate unemployment rate of 5.4%. The lowest unemployment rate is in Orange County at 3.9%. Though the West Coast ports’ agreement with International Longshore and Warehouse Union (ILWU) dock workers and Writer’s Guild of America (WGA) strike have been resolved, those and the Screen Actors Guild-American Federal of Radio and Television Artists (SAG-AFTRA) and the hospitality industry labor disputes are being felt severely in the region, especially in LA County. Particularly concerning are the ripple effects on the industry’s supply chain. These disputes bring uncertainty to the economy, putting financing for investments at risk. The transportation sector sustained growth through the pandemic as warehousing demands increased by retailers and ecommerce operators. Much of the demand draws from the ports of Los Angeles and Long Beach, which rank first and second in the U.S. in terms of annual containers (TEUs) handled. The twin ports handled 19 million containers in 2022, which if combined would make them the fifth busiest port in the world. However, the ports face several potential challenges and trade flows have sharply fallen. Some trade is being diverted to the east coast, which has been facilitated by the expansion of the Panama Canal in 2016 and which can place many items closer to their destination. U.S. imports from China, a significant place of origin for goods entering through L.A.'s ports, have also been declining since tariffs were imposed in 2018. Employment in the accommodations sector is 11% below the pre-pandemic high in February 2020 across the SCAG region, 14% below the pre-pandemic high in Los Angeles County, and 17% below pre-pandemic levels in the Inland Empire counties of Riverside and San Bernardino. While employment in the region’s tourism industry is not quite back to pre-pandemic levels, international passenger traffic at Los Angeles World Airports increased by 42% from January to July relative to last year. The region’s other airports have also observed a surge in passenger traffic. Honolulu Real EstateMarket fundamentals in Honolulu continue to remain robust relative to other urban markets throughout the United States, with continued low multifamily vacancies and modest cap rate expansion. This is indicative of the historic housing supply shortage plaguing the Honolulu market for decades. 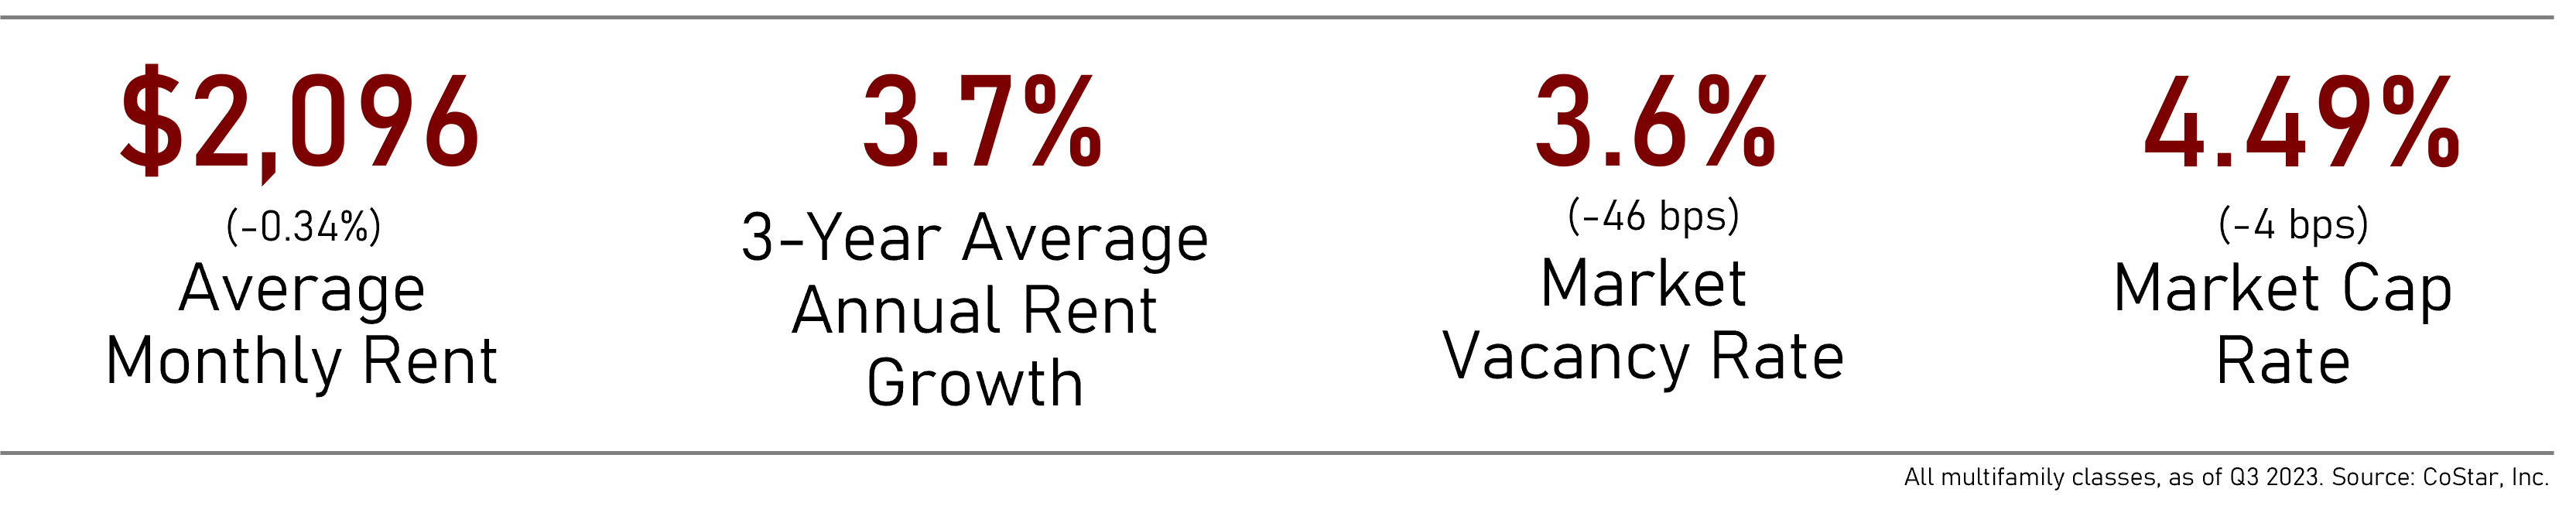 Multifamily Insights Average apartment rents in Honolulu are just under $2,100/month, which is a 2.9% increase from where they were a year ago. In the past three years, rents have increased a cumulative 11.0%. Vacancy in the Honolulu multi-family market is 3.6%, which is slightly below the 3.8% it was a year ago. The market cap rate for Honolulu is 4.49%, showing a slight compression in Q3, a 68-basis point expansion from the recent low of 3.81% in Q4 2021, and moderately above its trailing three-year average of 4.13%. This trend outperforms that of the greater US, which saw a 78-basis point increase in cap rates to 5.64% from the recent low of 4.86% in Q1 2022. Demand for rental housing in Honolulu is further driven by the high cost of homeownership, where the median sale price for a single-family home is now over $1.1 million. Despite robust area median incomes of $113,000 that outpace national levels, homeownership is simply not feasible for many households. Economy With a population just under 1 million, the leading industries driving the Honolulu economy are tourism and defense. The unemployment rate current stands at a low 2.9%, well below the US unemployment rate of 3.8%. Currently there are over 70,000 active duty, reserve, and civilian defense personnel across all six branches of the US military located in Hawai’i. The Basic Allowance for Housing (BAH) for military personal and their families stationed in Hawai’i increased by 16.75% in 2023, compared to the national average of 12.1%. According to the Hawai’i Department of Business, Economic Development and Tourism (DBEDT), in the first half of 2023 there were just over 2.74 million visitors to O’ahu, compared to approximately 2.26 million visitors (+21.4%) in the first half of 2022 and approximately 3 million visitors (-9.3%) in the first half of 2019, which was a record-setting year for arrivals. In the first half of 2023, total visitor spending was $10.78 billion, up significantly from $9.23 billion (+16.9%) in the first half of 2022 and from $8.86 billion (+21.7%) in the first half of 2019. Market Insight Take-Aways
This report has been prepared by Centre Urban Real Estate Services and its affiliates for use by a limited number of parties and has been obtained from sources believed reliable. While we do not doubt its accuracy, we have not verified it, and make no guarantee, warranty or representation about it. It is your responsibility to confirm, independently, its accuracy and completeness. CA Broker Lic. 01527042, HI Broker Lic. RB-24080 © 2023 Centre Urban Real Estate Services, Inc. All rights reserved.
0 Comments
|